
Observability is an essential and unavoidable piece part of distributed application architectures, there are many tools for observability, and in this post, we going to describe using OpenTelemetry and OpenSearch along with some dependent open-source tools to build the solutions.
What is Observability?
The act of collecting and analyzing data from applications and infrastructure so that you can understand their internal states and be alerted to, troubleshoot, and resolve issues with application availability and performance
Observability goal? is to troubleshoot the applications, not only that it helps improve the overall end-user experience from many perspectives…
Solution Architecture: Below is the used self-managed open-source components to build the solutions.
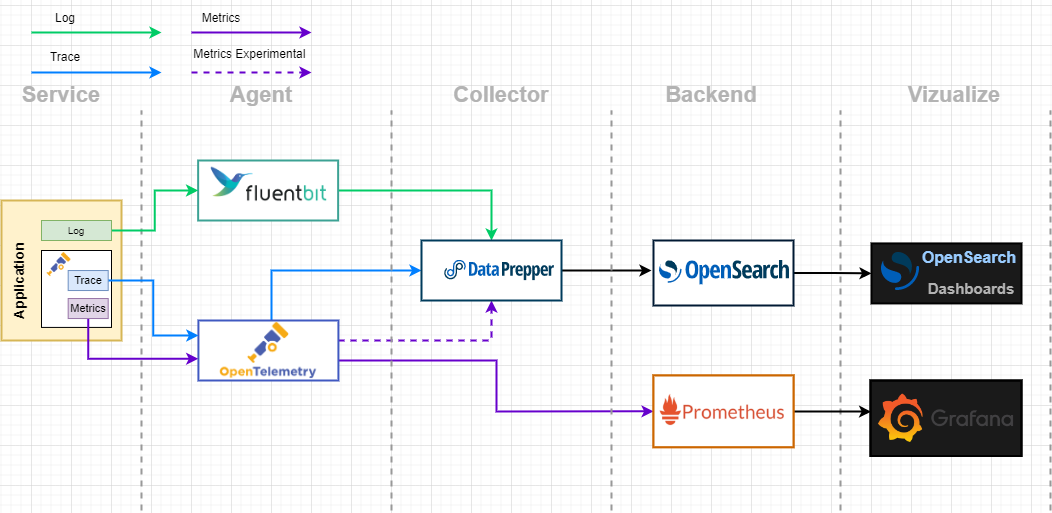
OpenTelemetry Instrumentations & Collector: Vendor-agnostic way to receive, process, and export telemetry data. More Detail
FluentBit: super fast, lightweight, and highly scalable logging and metrics processor and forwarder More Details
Data Prepper: an open-source data collector for observability data (trace, logs, metrics) that can filter, enrich, transform, normalize, and aggregate data for downstream analysis and visualization More Detail
OpenSearch & OpenSearch Dashboards: OpenSearch is a community-driven, Apache 2.0-licensed open-source search, that forked and developed from Elasticsearch 7.10 and its analytics suite that makes it easy to ingest, search, visualize, and analyze data. It consists of a data store and search engine (OpenSearch), and a visualization and user interface (OpenSearch Dashboards). More Detail
Prometheus: open-source systems monitoring and alerting toolkit More Detail
Grafana: Grafana allows you to query, visualize, alert on and understand your metrics no matter where they are stored More Detail
Alright, let’s start with the quick demo, I’ve below simple dummy microservices for this demonstration with different programming languages Nodejs, Go, and C# to showcase the language agnostic. For Metrics tried data-prepper as experimental and not included Prometheus since that is the common standard for metrics.
Sample application flow:
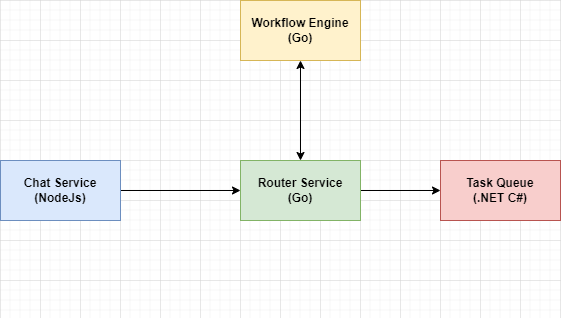
These applications will send telemetry data (trace, metrics) information using the Opentelemetry instrumentation to the local OTel collector agent and the log will be written in a regular console and forwarded to Fluentbit. Then these OTel and Fluentbit agents send that information to data-prepper. Data-prepper transforms and stores it in OpenSearch.
Usually, the monitoring setup for a cloud-native application will be deployed on Kubernetes with service discovery and high availability, but this post is for a quick prototype and setup using a single node from all the components with the docker-compose files.
observability/docker-compose.yaml contain all the observability components
docker-compose.yaml contains the sample microservices containers.
Let’s run it.
docker-compose -f observability/docker-compose.yaml up -d
docker-compose -f docker-compose.yaml up -d
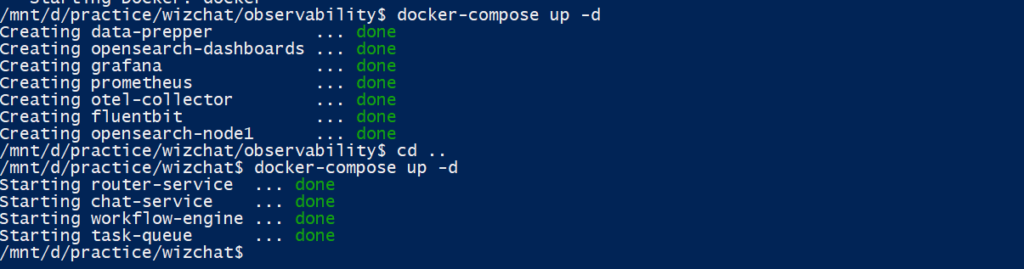
That’s it, both application and observability containers are up and running, let me invoke chat initiate API from the browser
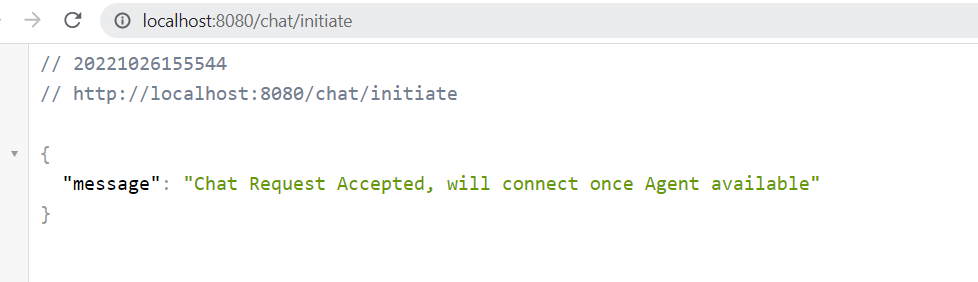
Awesome, we could see the logs, trace, and metrics information in our Open search UI :)
Okay, today’s challenges and what’s Next?
Logging : If you see our diagram there will be two agents Fluent and Opentelemetry Collector, the reason is that Opentelemetry Collector still doing development for the Logging signal for many programming languages. Very soon either one will be our agent for all signals(logs, trace, metrics) to collect, and forward from applications.
Another problem here, we used 3 programming languages, each using its own structure logging library Nodejs(Winston), .NET (Serilog), and Go (Zap) and all the Log Model is different, even the same we could see in the sample. If we want to achieve we should have a common contract across the programing language. open telemetry Log Model specification has this, once Opentelemetry Logging matures we will have this common structure and fields across the programing language without any additional efforts.
Below is the current status of open telemetry instrumentations for the programing language we used, for a complete supported programing language visit here.
LanguageTracesMetrics****Logs.NETstablestableLogger is stable but the exporter is not stableGostableAlphaNot yet implementedJavascriptstableRelease candidateDevelopment
Metrics: Data-Prepper and OpenSearch were tried as experimental but If you see the diagram Promotheious will be the solution for metrics, our example doesn’t include the same, Promotehus have many features. I think Metrics are still experimental in data-prepper, but If Open search and data-prepper metrics are stable, I think in most use cases it would be an awesome solution.
Conclusion: There are many tools and platforms available for observability solutions mostly some doing this in their specific area example tracing (Jaeger, Zipkin, etc) and Metrics(Promitious, etc), but one great benefit Open search tries to bring all the signals to one backend for better correlation and monitoring and fully open source solution.
Source Code GitHub URL: https://github.com/arulselvan/wizchat/tree/practice-observability